![]()
![]()
![]()
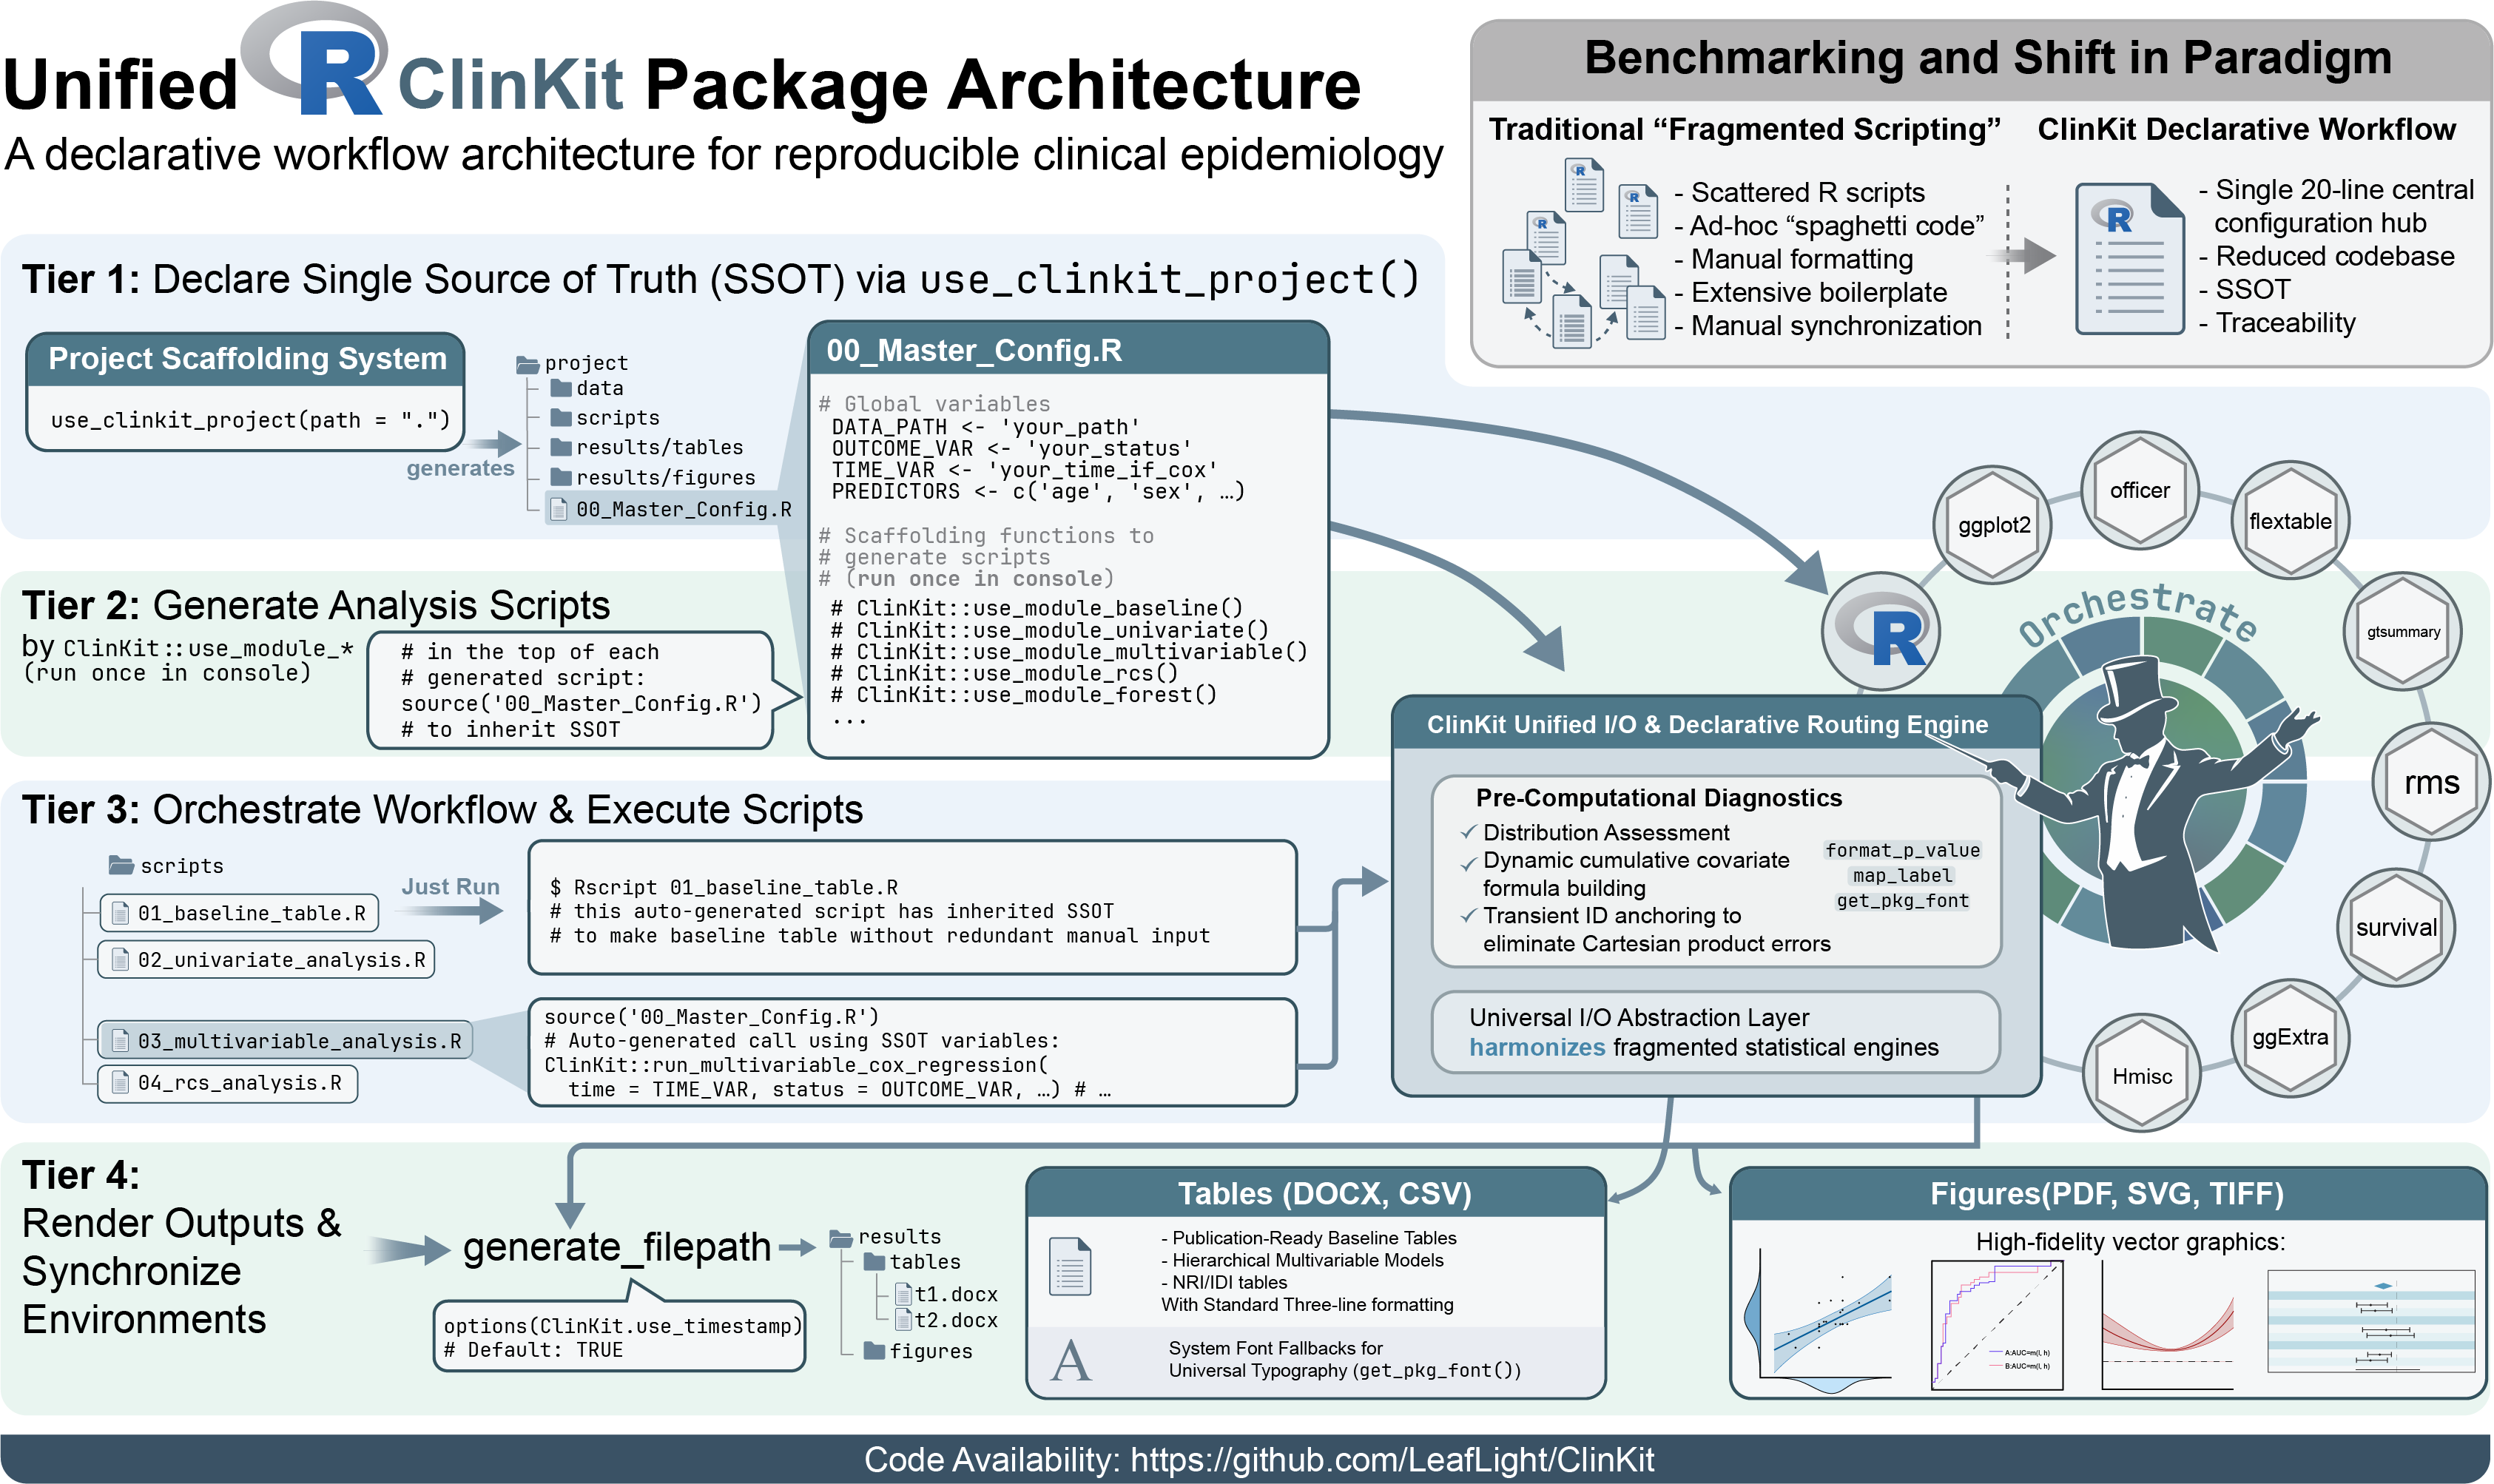
ClinKit is an advanced R framework tailored for clinical researchers and epidemiologists. It transforms cleaned datasets into publication-ready artifacts (Word tables and high-resolution figures) through a standardized, modular, and highly reproducible workflow.
🌟 Key Highlights
- ⚡ Interactive Scaffolding: Deploy a complete clinical project structure and master control center with a single command.
- 📈 Hierarchical Sequential Modeling: Automatically generate Model 1 (Unadjusted) through Model N (Fully Adjusted) for Logistic, Cox PH, and Multinomial regressions.
- 🧪 Built-in Methodological Rigor: Automated normality testing for intelligent descriptive statistics and “Anti-Cartesian” alignment for multi-level outcome reporting.
-
📄 Journal-Ready Outputs: Unified I/O routing with auto-formatted
.docxtables (standardized Times New Roman and three-line table layout).
📦 Installation
You can install the development version of ClinKit from GitHub:
# install.packages("devtools")
devtools::install_github("LeafLight/ClinKit")
🚀 The ClinKit Workflow (Standard Operating Procedure)
ClinKit enforces a “Configuration-Driven” modular workflow to ensure your research is traceable and reproducible.
Step 1: Initialize the Environment
This creates a standardized directory structure (data/, scripts/, results/) and the 00_Master_Config.R dashboard.
Step 2: Global Variable Configuration
Open 00_Master_Config.R to define your outcomes, primary predictors, and hierarchical adjustment layers (Model 1-N).
Step 3: Deploy Analysis Modules
Run the following functions within your config center to generate standalone, task-specific scripts:
use_module_baseline()      # Deploys Table 1 (Patient Characteristics)
use_module_multivariable() # Deploys Table 3 (Sequential Adjusted Models)
use_module_rcs()           # Deploys Non-linear Trend Analysis (RCS)
use_module_forest()        # Deploys Subgroup Interaction Plots
🛠 Core Analytical Suite
1. Automated Baseline Reporting (make_baseline_table)
Features built-in Shapiro-Wilk/KS testing. It automatically switches between Mean ± SD and Median (IQR) based on distribution and exports directly to publication-quality Word documents.
2. Hierarchical Regression Engines
-
run_multivariable_logistic_regression(): Standardized Adjusted Odds Ratios (aOR). -
run_multivariable_cox_regression(): Sequential Adjusted Hazard Ratios (aHR). -
run_multivariable_multinomial_logistic_regression(): Handling multi-category outcomes with perfect row alignment across adjustment levels.
3. Advanced Visualization & Analytics
-
generate_rcs_plot(): Restricted Cubic Splines with multi-model support. -
subgroup_forest(): Subgroup interaction forest plots with professional color themes (Blue, Green, Cyan). -
run_reclassification_analysis(): Comprehensive calculation of NRI (Net Reclassification Index) and IDI (Integrated Discrimination Improvement).
💎 Why ClinKit?
| Feature | ClinKit Framework | Traditional R Scripting |
|---|---|---|
| Adjustment Layers | Automated (Model 1-N) | Manual formula rewriting |
| Reference Categories | Auto-persisted (1.00 (Ref)) | Manual row insertions |
| I/O Management | Unified routing & timestamps | Scattered ggsave / write.csv
|
| Reproducibility | Config-driven modularity | Fragile, monolithic scripts |
📖 Documentation
For full function references and step-by-step case studies, please visit: ClinKit Documentation Portal
🤝 Contributing
Methodological contributions, bug reports, and pull requests are welcome!
- Author: Hualin Wang
- License: MIT